📊 Statistics Tutorial
Range, Variance & Standard Deviation
Range, Variance & Standard Deviation
for Grouped Data
A step‑by‑step mathematical guide using frequency distributions
📋 Problem & Source Data
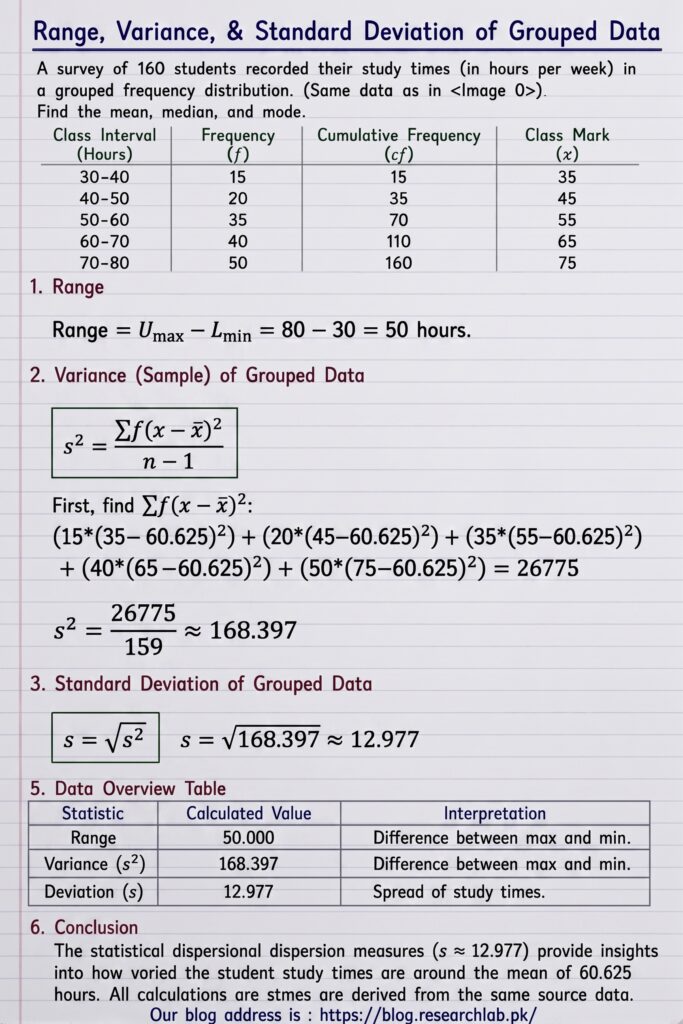
A survey of 160 students recorded weekly study times (hours). The grouped frequency distribution is:
| Class Interval (Hours) | Frequency (\(f\)) | Class Mark (\(x\)) | \(f \cdot x\) | \((x – \bar{x})^2\) | \(f(x – \bar{x})^2\) |
|---|---|---|---|---|---|
| 30 – 40 | 15 | 35 | 525 | 656.64 | 9,849.61 |
| 40 – 50 | 20 | 45 | 900 | 244.14 | 4,882.81 |
| 50 – 60 | 35 | 55 | 1,925 | 31.64 | 1,107.42 |
| 60 – 70 | 40 | 65 | 2,600 | 19.14 | 765.63 |
| 70 – 80 | 50 | 75 | 3,750 | 206.64 | 10,332.03 |
| Total | \(\sum f = n = 160\) | — | \(\sum fx = 9,700\) | — | \(\sum f(x – \bar{x})^2 = 26,775\) |
📐 Step 0: Grouped Mean (\(\bar{x}\))
First, compute the sample mean for grouped data:
$$\bar{x} = \frac{\sum f \cdot x}{\sum f} = \frac{9,700}{160} = 60.625 \text{ hours}$$
📏 Step 1: Range
For grouped data, range = upper limit of highest class − lower limit of lowest class:
$$\text{Range} = U_{\text{max}} – L_{\text{min}} = 80 – 30 = 50 \text{ hours}$$
📉 Step 2: Sample Variance (\(s^2\))
Using the grouped formula with \(n-1\) degrees of freedom:
$$s^2 = \frac{\sum f(x – \bar{x})^2}{n – 1} = \frac{26,775}{160 – 1} = \frac{26,775}{159} \approx 168.397$$
📊 Step 3: Standard Deviation (\(s\))
Take the positive square root of the variance:
$$s = \sqrt{s^2} = \sqrt{168.397} \approx 12.977 \text{ hours}$$
⚡
Quick Verification Tool
Dynamically re‑compute all figures from the raw grouped data:
✨ MathJax renders LaTeX • interactive JS verifies